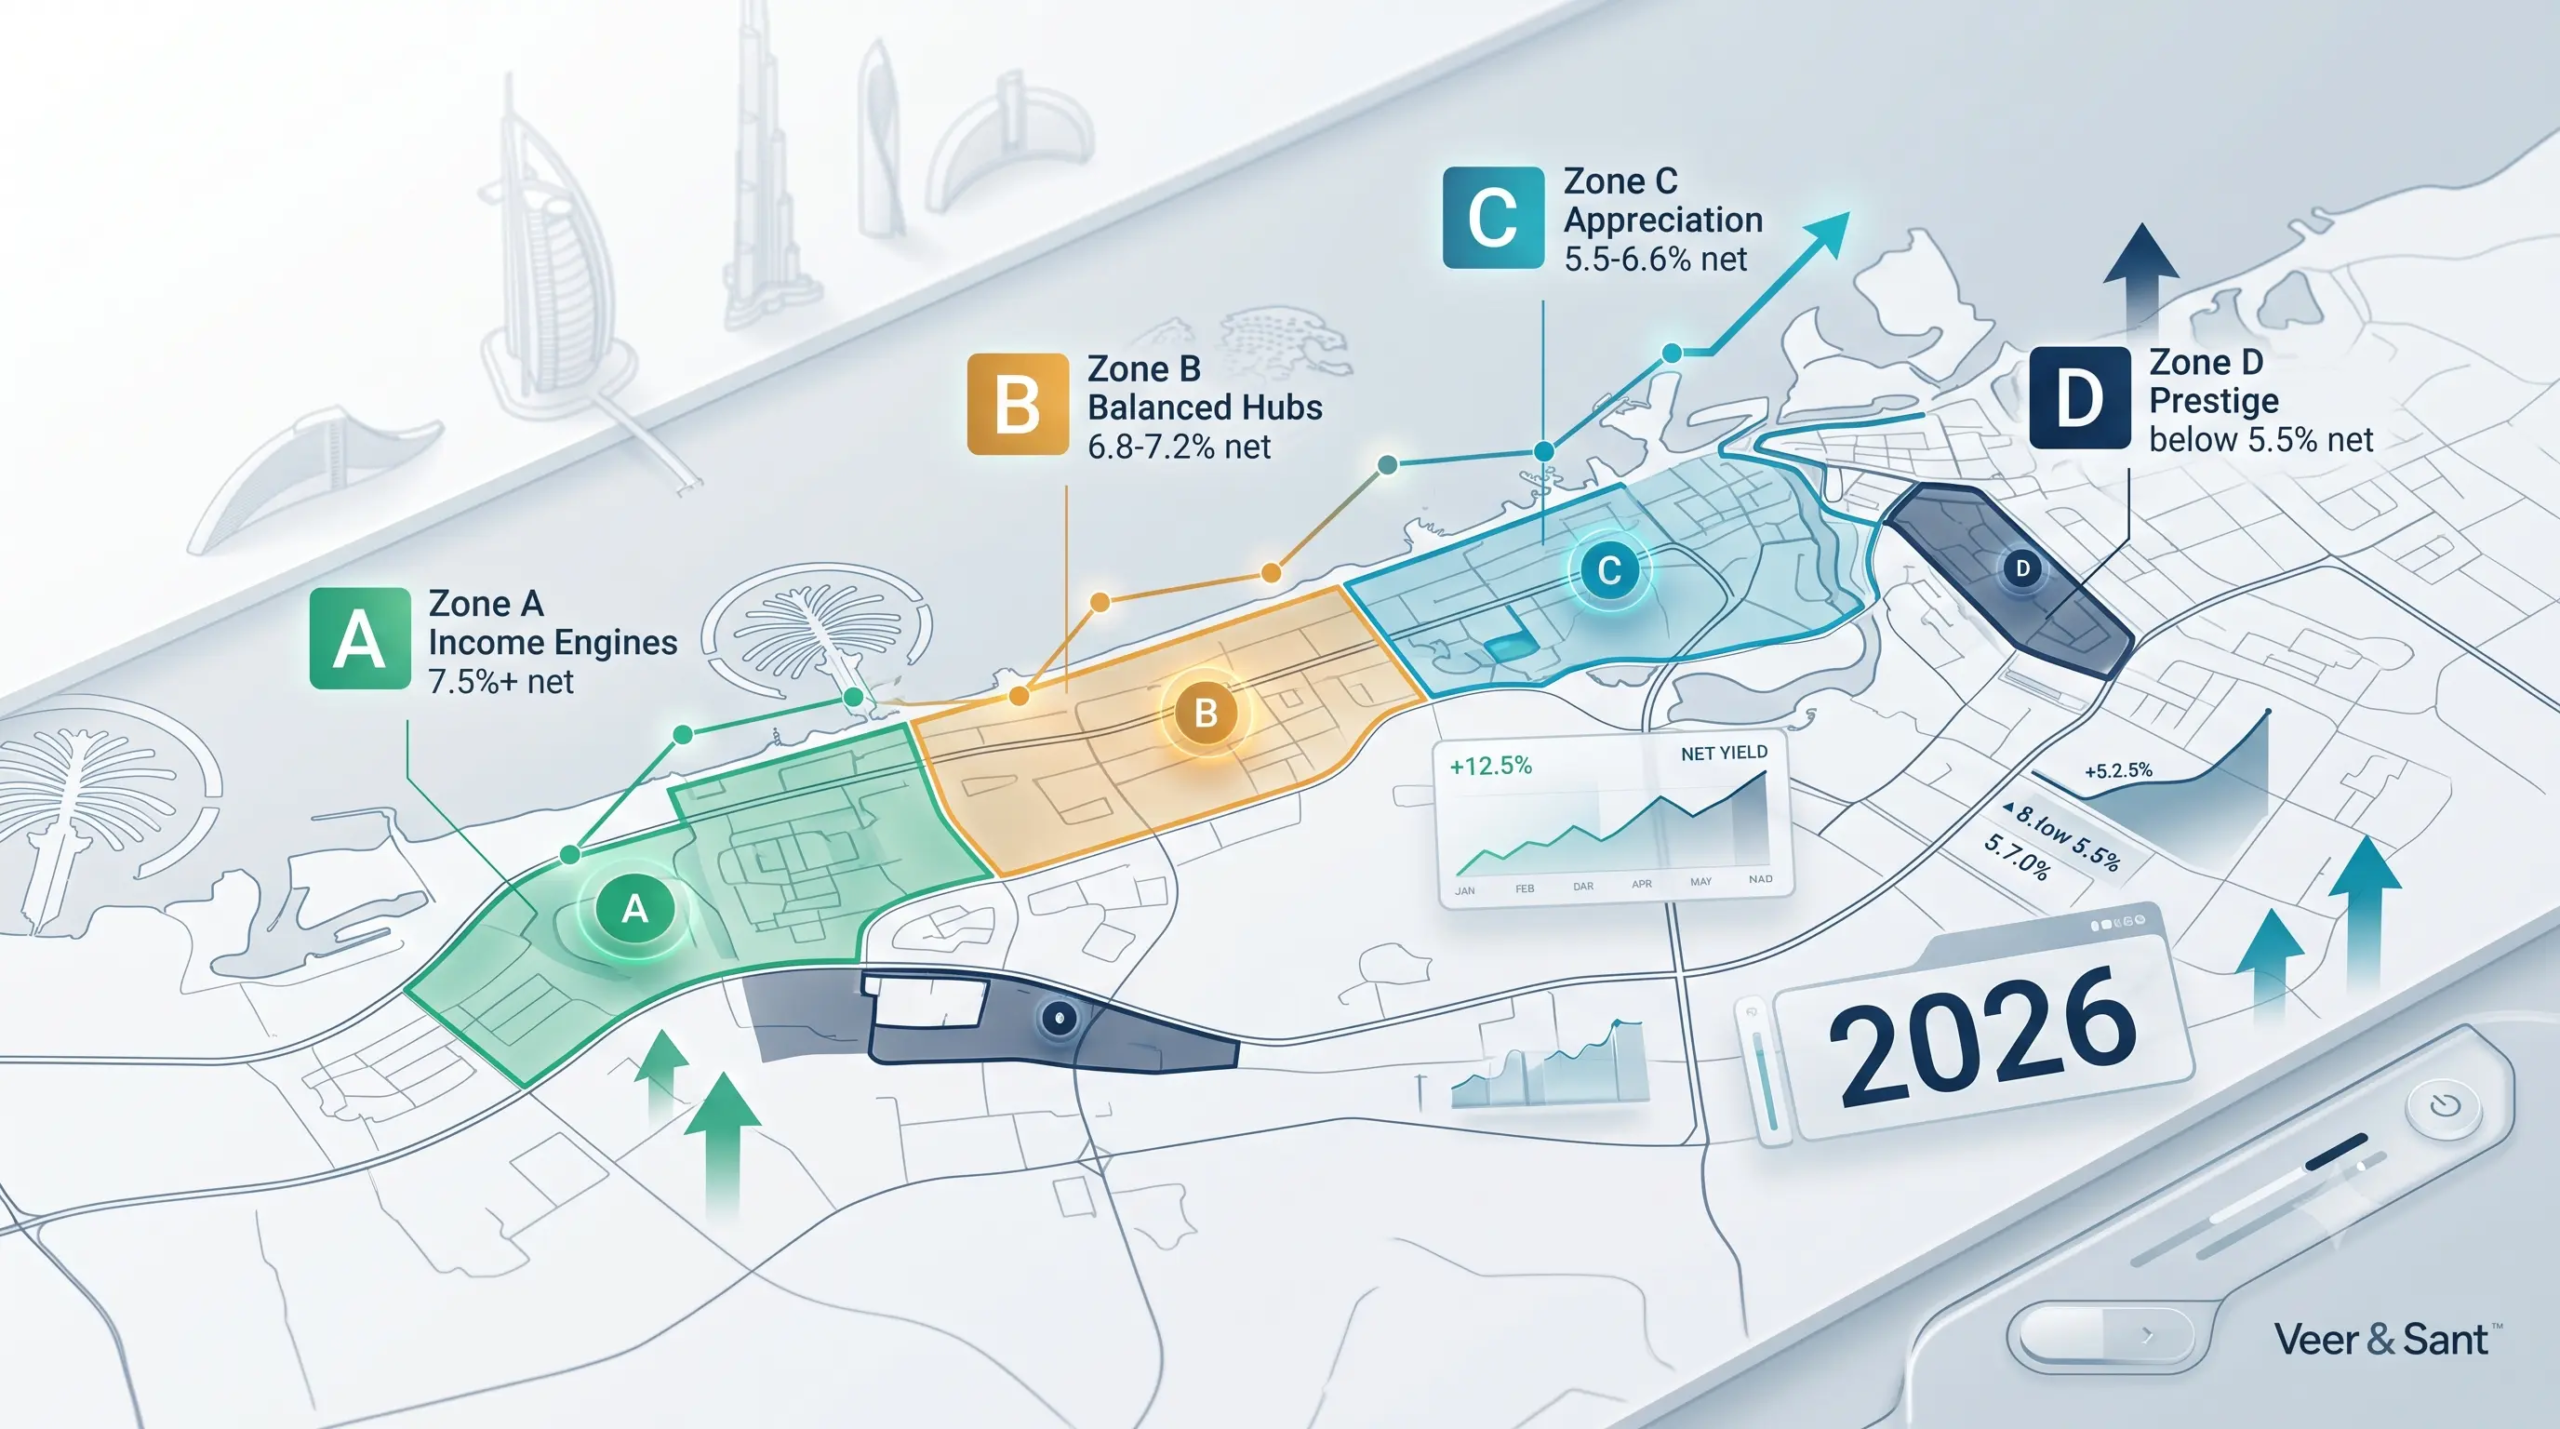
Dubai Growth Hubs: The 2026 Map
In Dubai, the highest yield and the highest growth are rarely the same postcode. This is the map that shows you which is which — built on real net yields, not the gross numbers everyone else quotes.
One number decides almost everything — and most investors read it wrong
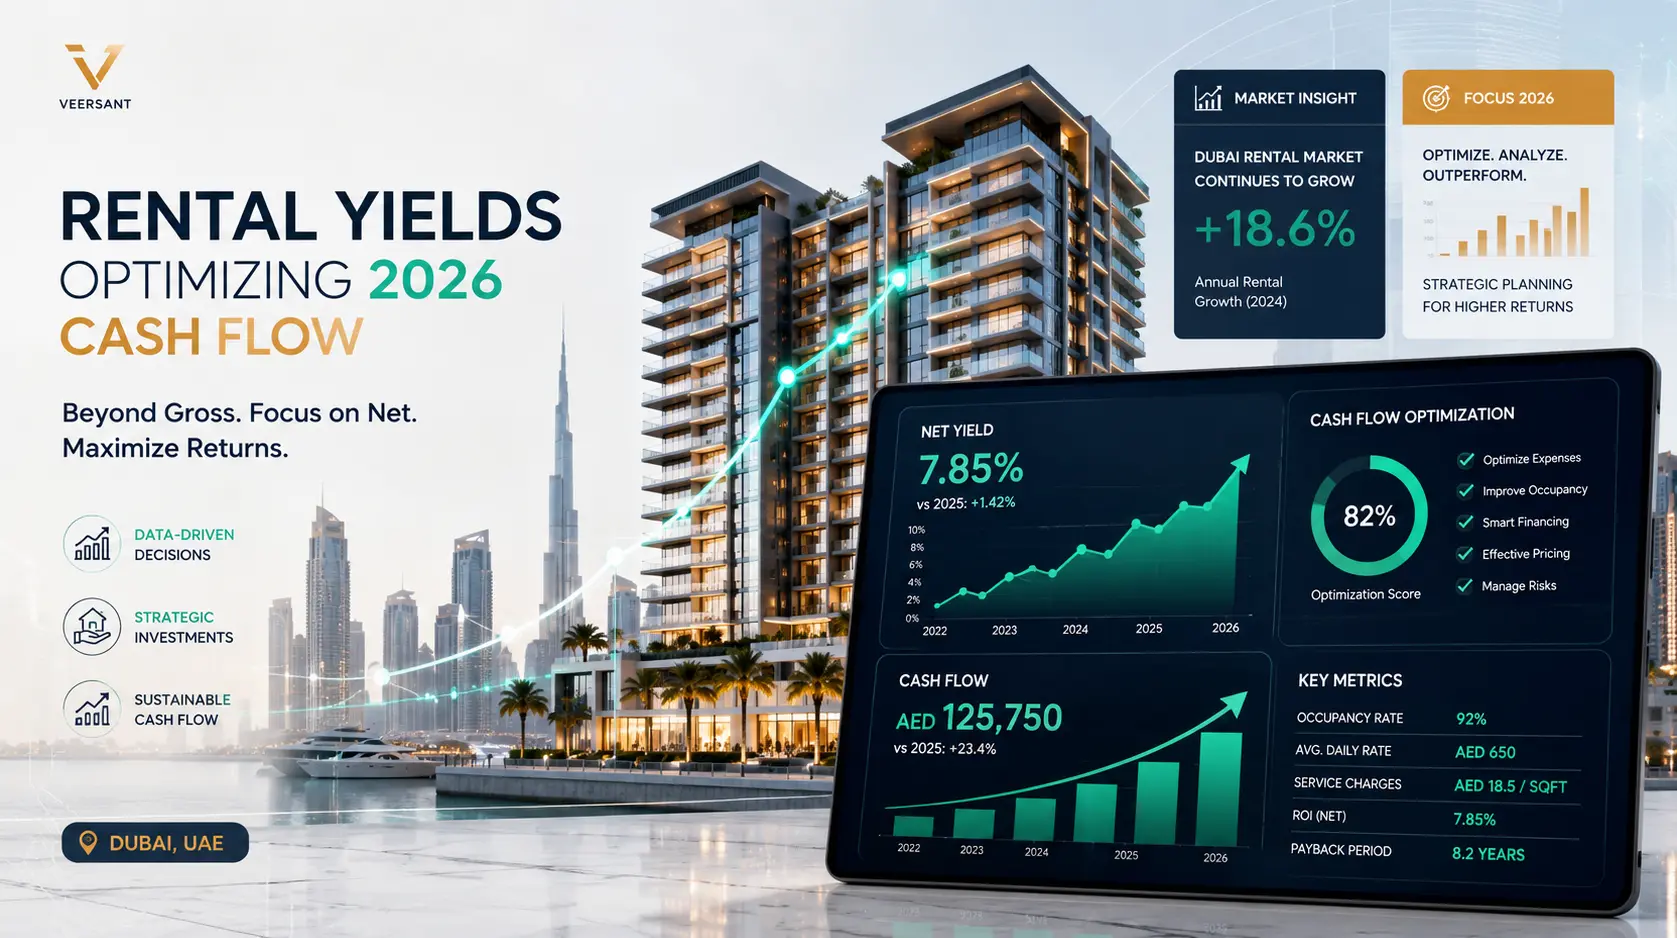
When analyzing the Dubai Growth Hubs 2026 Map, the first thing you’ll notice is that gross yields of 8% or 9% are often used as a headline on listing portals. However, for an overseas owner, that number quietly collapses to 4–5% once service charges, management, voids and transaction costs are taken out.
The communities with the loudest gross figures are rarely the ones building the most wealth. So we don’t rank Dubai by hype. We rank it by two honest questions: what does this hub actually pay you after costs, and which direction is it moving.
Plot every community against those two questions and Dubai stops looking like one market — it starts looking like four very different ones.
The one idea to hold onto
The highest yield and the highest growth are rarely the same postcode. A high yield means income; a falling yield in a strong area usually means prices are climbing. Knowing which zone you’re buying into is the whole game.
Dubai Growth Hubs 2026 Map: Four zones, four jobs
Every hub on the 2026 map does one of four jobs for your portfolio. Match the zone to your goal before you ever look at a floor plan.
Zone A · Income Engines
- Highest net yield in Dubai
- Cash flow first
- Modest capital growth
Zone B · Balanced Hubs
- The sweet spot
- Income and appreciation
- Where most overseas buyers start
Zone C · Appreciation
- Price-led, yields compressing
- Capital concentrating
- Growth over cash flow
Zone D · Prestige
- Trophy addresses
- Deep resale liquidity
- Wealth preservation
Dubai Growth Hubs 2026 Map: 2026 in five numbers
Source: REIDIN Residential Yield Rankings by Community (Dubai apartments, all bedrooms), 2026. Net yields are indicative community averages — re-verify before relying on them.
Income Engines · 7.5%+ net
For investors who want maximum cash flow per dirham invested — comfortable with slower capital growth and a more transient tenant base.
| Community | Net yield | Trend 2026 |
|---|---|---|
| Discovery Gardens | 7.7% | ▲ rising |
| International City | 7.6% | ▼ from 8.3% |
| Dubai Production City (IMPZ) | 7.6% | ≈ stable |
Balanced Growth Hubs · 6.8–7.2% net
The core overseas yield investor’s zone. Healthy net income, a credible appreciation story, deeper end-user demand and easier resale. If you buy in one zone, it’s usually this one.
| Community | Net yield | Trend 2026 |
|---|---|---|
| Remraam | 7.1% | ≈ stable |
| Jumeirah Village Triangle | 7.1% | ≈ holding |
| Dubai Sports City | 7.0% | ▲ from 6.4% |
| Al Furjan | 7.0% | ▲ from 6.8% |
| Living Legends | 7.0% | ▲ rising |
| Jumeirah Village Circle (JVC) | 6.9% | ≈ stable |
| Damac Hills | 6.9% | ▲ rising |
| Liwan | 6.9% | ▲ from 6.6% |
| Dubai Silicon Oasis | 6.8% | ▲ from 6.6% |
Appreciation Hubs · 5.5–6.6% net
For investors prioritising capital growth over cash flow. A falling yield here usually means values are climbing faster than rents — capital is concentrating, often where the deepest-pocketed buyers are active.
| Community | Net yield | Trend 2026 |
|---|---|---|
| Arjan | 6.6% | ▼ from 7.1% |
| Green Community West NEW | 6.5% | new entry |
| Dubai Festival City | 6.4% | ▲ rising |
| Dubai Science Park | 6.3% | ▲ from 6.1% |
| Dubai South Residential | 6.3% | ▼ from 6.8% |
| Jumeirah Lake Towers (JLT) | 6.2% | ≈ stable |
| Dubailand Residence Complex | 6.1% | ≈ stable |
| Dubai Hills Estate | 6.0% | ▼ from 6.8% |
| The Greens | 5.8% | ≈ stable |
| Business Bay | 5.7% | ≈ stable |
| Motor City | 5.7% | ▲ from 5.3% |
| Mirdif | 5.7% | ▼ from 6.1% |
| Dubai Creek Harbour | 5.6% | ▼ from 6.0% |
| Dubai Marina | 5.5% | ≈ stable |
| The Views | 5.5% | ≈ stable |
Prestige & Capital Preservation · below 5.5% net
For high-net-worth buyers protecting and parking capital in trophy addresses with deep resale liquidity. Yield is the price of prestige — not the reason to buy.
| Community | Net yield | Trend 2026 |
|---|---|---|
| Downtown Dubai | 5.4% | ▼ from 5.8% |
| Jumeirah Beach Residence (JBR) | 5.3% | ≈ stable |
| Al Sufouh | 5.2% | ▲ rising |
| Jumeirah | 5.1% | ▲ from 4.8% |
| Al Jadaf | 5.1% | ▲ from 4.6% |
| Meydan City | 4.8% | ▼ from 5.2% |
| The Old Town | 4.6% | ▼ from 4.9% |
| Palm Jumeirah | 4.2% | ▼ from 4.4% |
| DIFC | 4.1% | ▼ from 4.4% |
Trend arrows compare January 2026 to the latest available reading. Net yields vary by building, unit and management costs.
“Be honest with them. Show them the data — but make them understand the fundamentals. That’s the only way to advise.” — The principle behind every Veer & Sant guide
What’s actually moving on the map
A single snapshot tells you where a hub is. The 2026 trend tells you where it’s going — and that’s where the real decisions live.
Yields rising
- Dubai Sports City · 6.4 → 7.0%
- Motor City · 5.3 → 5.7%
- Liwan · 6.6 → 6.9%
- Al Jadaf · 4.6 → 5.1%
- Al Furjan · 6.8 → 7.0%
Yields compressing
- Dubai Hills Estate · 6.8 → 6.0%
- International City · 8.3 → 7.6%
- Dubai Creek Harbour · 6.0 → 5.6%
- Downtown Dubai · 5.8 → 5.4%
- Arjan · 7.1 → 6.6%
New & notable
- Green Community West · new at 6.5%
- Jumeirah · 4.8 → 5.1%
- Dubai Science Park · 6.1 → 6.3%
Falling yield, rising value
Dubai Hills Estate and Dubai Creek Harbour show the sharpest yield compression on the map. That isn’t softness — it’s capital concentrating in the hubs where the deepest buyers are most active.
Gross yield is the brochure. Net yield is the bank statement.
The gap between the two is where most overseas investors lose money they never budgeted for. The same apartment can advertise one number and deliver another.
Gross yield
Annual rent ÷ purchase price. Ignores every cost of actually owning the asset.
Net yield
After service charges, management, maintenance, voids, agency and transaction costs — the number that pays you.
Why every figure here is net
A 9% gross hub that nets 7% can still beat a 6% gross hub that nets 5% — but only if you read past the headline. That’s the point of an advisory conversation, not a portal search.
The Veer & Sant approach
Start with net, not gross
We model the real return after every cost before you commit a dirham — no headline figures.
Define your plan first
Income, growth, residency or preservation. Your goal decides the zone — not the other way round.
Match the hub to the plan
Right zone, right developer, right entry price for this point in the cycle.
Handle it in-house
Conveyancing, management, company structures and resale under one accountable roof.
Tell you the truth
If a hub is wrong for your goal, we’ll say so — even when it costs us the deal.
Before you pick a zone
- Is your goal income, growth, residency or preservation — and clearly defined?
- Have you matched that goal to a zone (A income → D preservation)?
- Are you reading net yields, not gross headline figures?
- Have you checked the trend, not just the snapshot — is the hub rising or compressing?
- Does a compressing yield fit your plan (growth) or work against it (income)?
- Have you set a holding period of at least three to five years?
- Is your advisor showing you the source data, not just a sales pitch?
Straight answers
Should I just buy the highest-yield community?
Why are yields falling in places like Dubai Hills and Creek Harbour?
Are these gross or net yields?
Is Dubai a safe place to hold property right now?
How do I know which zone fits me?
Build your 2026 map with people who’ll tell you the truth
No pressure, no pitch. We’ll walk through the data, your goals, and which zone actually fits you — honestly.