Rental Yields: Optimizing 2026 Cash Flow
Your cash flow isn’t the yield you were quoted. It’s what survives after the leaks. This guide shows you exactly where the money escapes between gross and net — and the levers that put it back in your account.
Cash flow is what survives the leaks
When it comes to Rental yields and optimizing 2026 cash flow, every Dubai listing leads with a gross yield. It’s the biggest, friendliest number available: annual rent divided by price. It’s also the number you will never actually receive.
Real cash flow is net — what’s left after service charges, management, voids, maintenance and the cost of letting the unit again each year. Across Dubai in 2026, that gap runs roughly 1 to 1.8 percentage points of yield. On a high-headline community it is the difference between a 9% story and a 7% reality.
Optimizing cash flow isn’t about chasing the highest gross. It’s about choosing where the net holds up — and then plugging the leaks you control.
The one idea to hold onto
Two apartments can advertise the same gross yield and pay you very different amounts. The winner is decided by the leaks — and most of them are controllable.
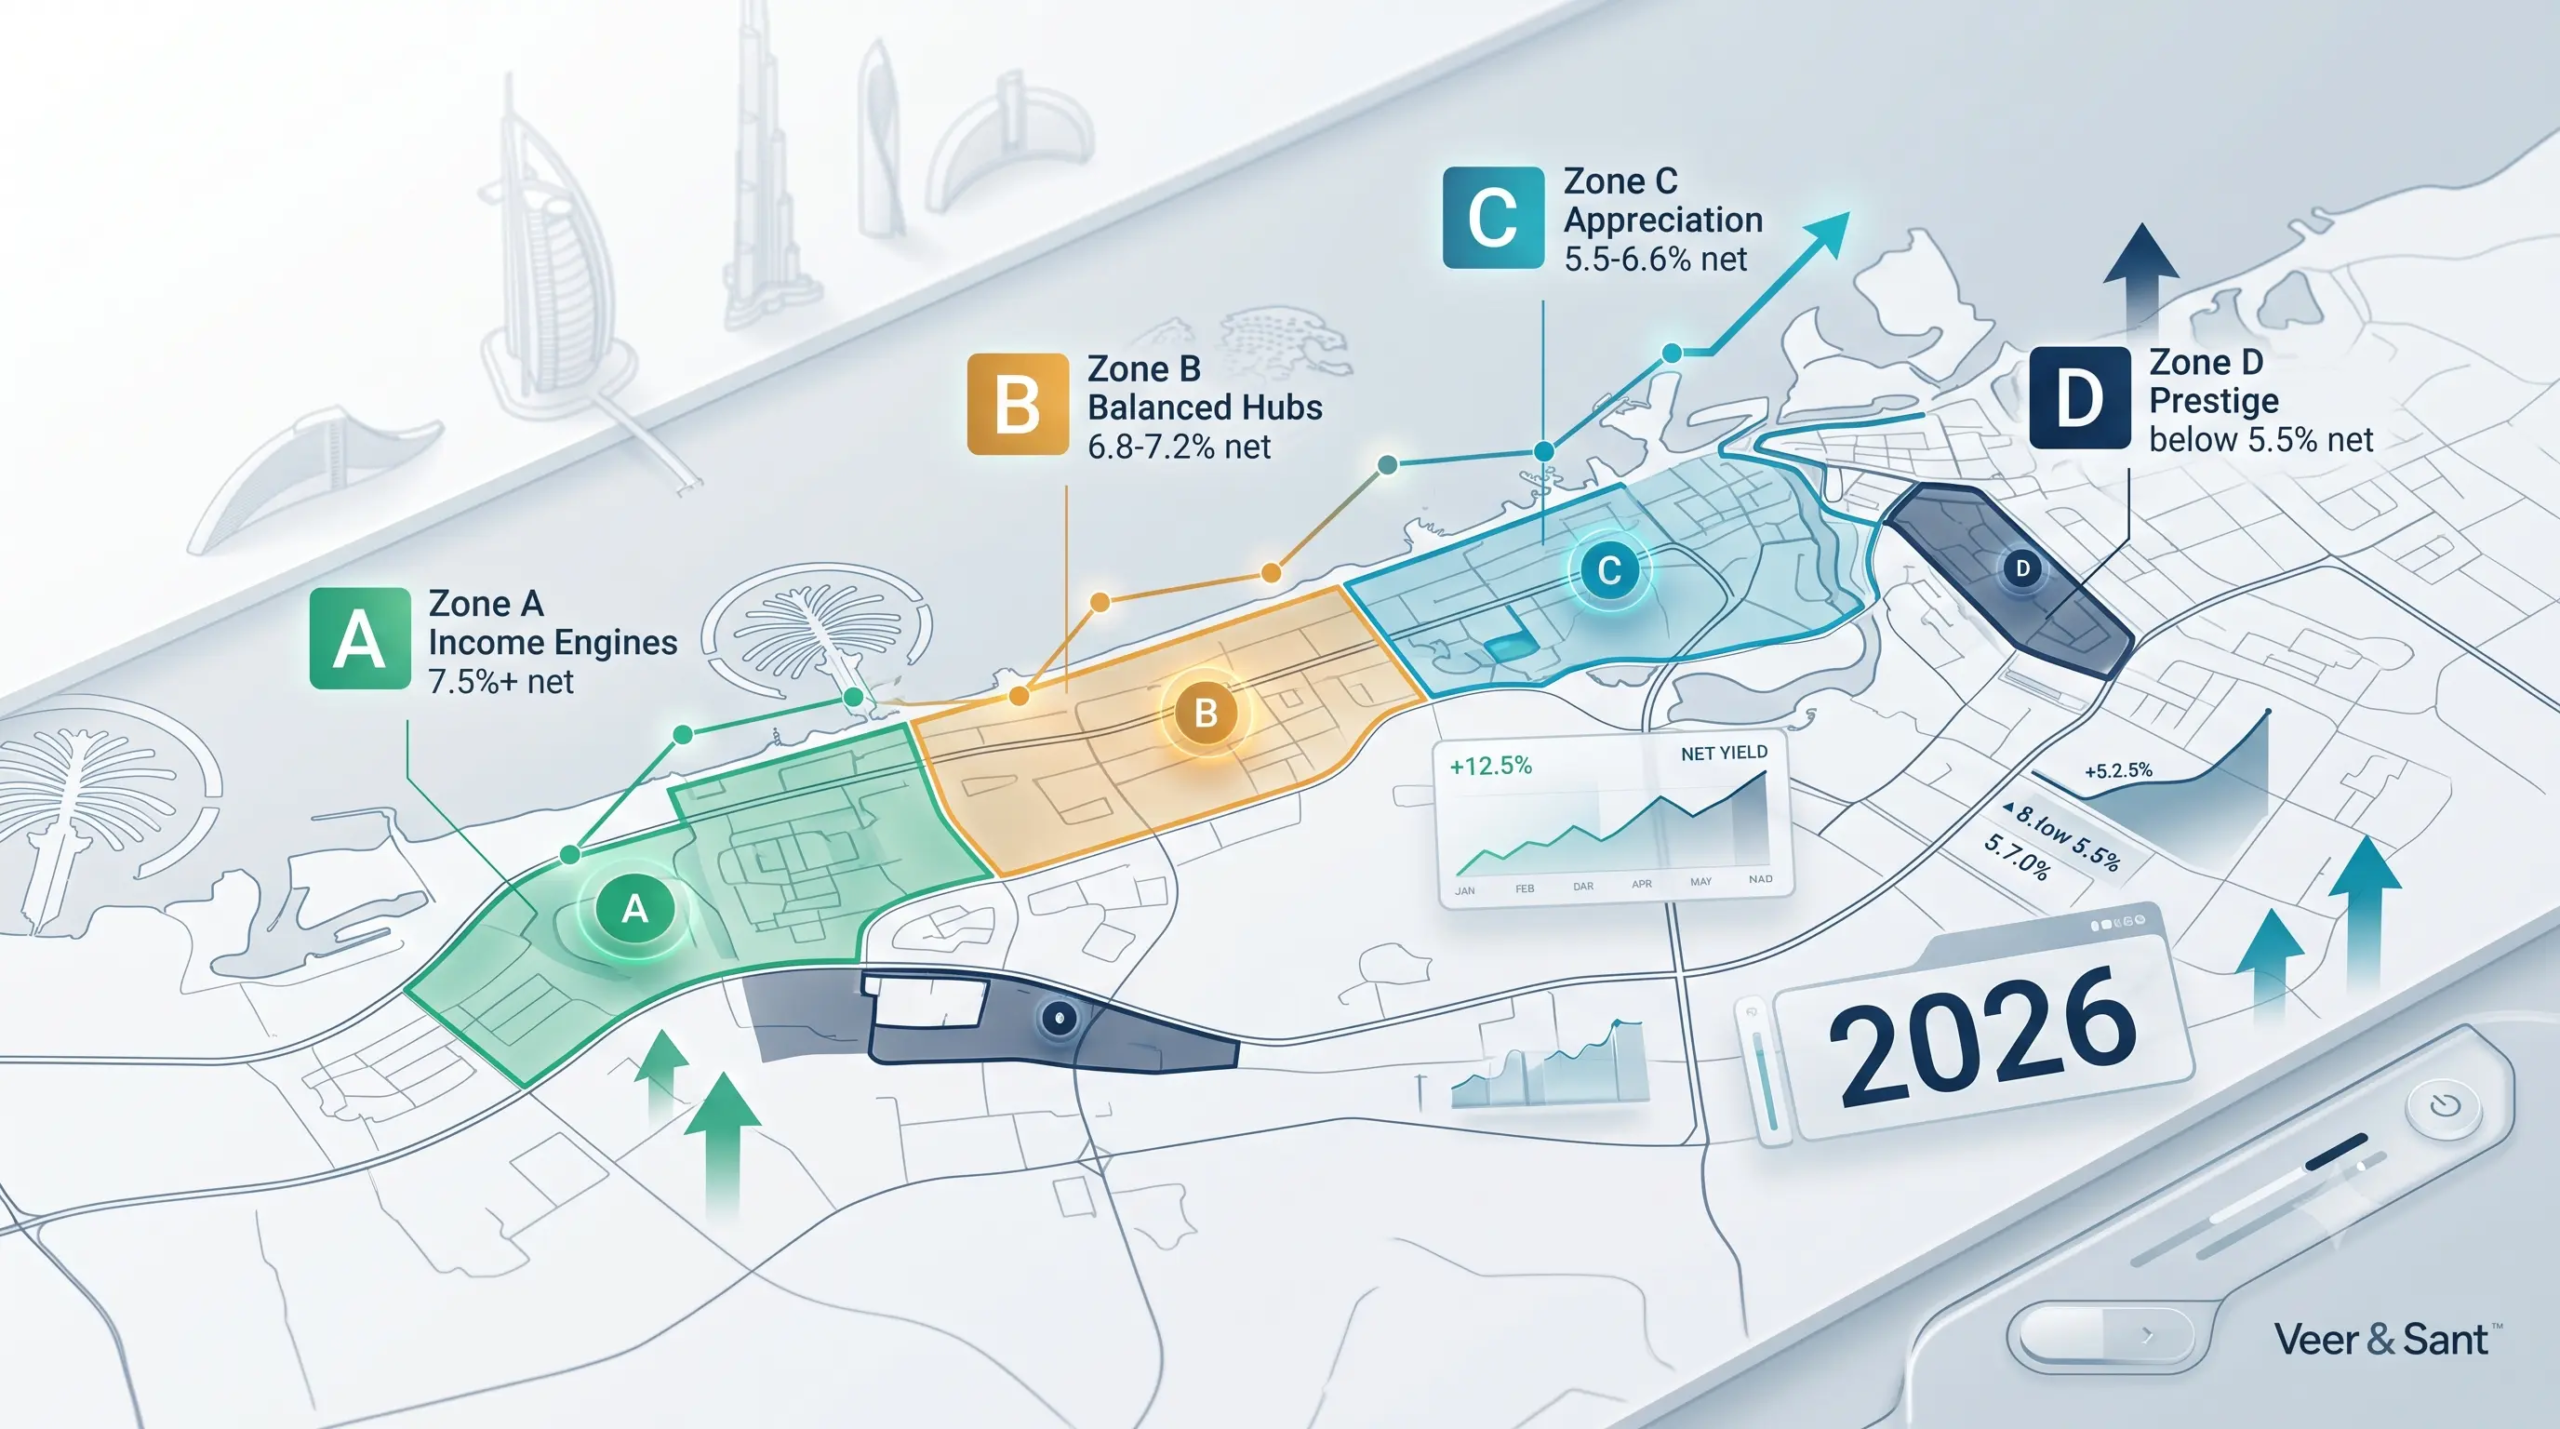
The cash-flow picture in five numbers
Source: REIDIN Residential Yield Rankings by Community (Dubai apartments, all bedrooms), latest 2026 snapshot. Net yields are indicative community averages — your personal net depends on the leaks you control.
Where the cash flow actually holds up
Same metric, two columns. “Leak” is the yield that evaporates between the headline gross and the market net. Notice the highest-gross communities also leak the most — and that net, not gross, reorders the table.
| Community | Gross | Net (you keep) | Leak |
|---|---|---|---|
| Discovery Gardens | 9.2% | 7.7% | 1.5 |
| Remraam | 8.9% | 7.1% | 1.8 |
| Dubai Sports City | 8.5% | 7.0% | 1.5 |
| Al Furjan | 8.1% | 7.0% | 1.1 |
| Jumeirah Village Circle (JVC) | 8.0% | 6.9% | 1.1 |
| Arjan | 7.6% | 6.6% | 1.0 |
| Dubai Hills Estate | 7.0% | 6.0% | 1.0 |
| Business Bay | 6.7% | 5.7% | 1.0 |
| Dubai Marina | 6.5% | 5.5% | 1.0 |
| Downtown Dubai | 6.2% | 5.4% | 0.8 |
| DIFC | 5.1% | 4.1% | 1.0 |
| Palm Jumeirah | 5.0% | 4.2% | 0.8 |
Latest 2026 REIDIN snapshot. Leak = gross − net (percentage points). Market net is largely after service charges; an overseas owner’s take-home can be lower once management, voids, agency, finance and FX are added.
The five leaks between gross and net
Every point of lost yield comes from one of these. Three of the five are within your control.
Service charges
- Charged per sq ft, annually
- Prime towers run highest
- The biggest single leak in Zone D
Voids & turnover
- Empty weeks between tenants
- Worst in transient communities
- Controllable with management
Management & maintenance
- 5–10% management fee typical
- Repairs, snagging, fit-out
- Pays for itself by cutting voids
Re-letting & agency
- Commission each new tenancy
- Ejari, renewals, admin
- Lower with longer tenancies
Finance & transaction
- ~4% one-off DLD transfer
- Mortgage interest & FX
- Amortise over the hold period
The lever most owners ignore: unit mix
Within the same building, a studio or one-bedroom almost always out-yields a three-bedroom on a net basis. Smaller units cost less to buy, rent for proportionally more, and re-let faster — which directly shrinks the voids leak.
That’s why the highest-net communities on the leak map are apartment-led, value-end addresses, not the villa enclaves. If cash flow is the goal, the unit type matters as much as the postcode.
Five levers to lift net cash flow
You can’t change the market. You can change how much of it you keep.
1 · Buy net, not gross
- Rank on net, not headline
- Favour low-service-charge stock
- Zone A & B for pure income
2 · Right-size the unit
- Studios & 1-beds yield more
- Faster to re-let
- Lower capital at risk
3 · Kill the voids
- Professional management
- Renew early, price to market
- Monthly-payment tenancies
4 · Pick the right let model
- Short-term in tourist hubs
- Long-term for stability
- Match model to location
5 · Structure the costs
- Interest-free off-plan plans
- Amortise transfer & fit-out
- Plan FX & financing
Long-term vs short-term holiday lets
The single biggest cash-flow decision after the purchase. Neither wins everywhere — it depends on location, effort and how much void risk you’ll carry.
| Factor | Long-term let | Short-term / holiday let |
|---|---|---|
| Gross income potential | Steady, contracted | Higher in tourist hubs |
| Voids | Low — annual tenancy | Higher between bookings |
| Running costs | Lower | Cleaning, furnishing, platform fees |
| Management effort | Light | Active — best outsourced |
| Best locations | Community & value hubs | Marina, Downtown, JBR, Palm, Creek |
| Best for | Hands-off, predictable cash flow | Maximised income in prime, with management |
The prime-area workaround
Zone D addresses (Palm, Downtown, Marina) net the least on a long let — but they’re exactly where short-term holiday lets earn a premium. The right model can rescue the cash flow a long tenancy leaves on the table.
The 2026 occupancy edge: monthly rent
Dubai’s shift toward monthly rent payments widens your tenant pool and shortens void periods — more applicants can afford to move in without a year’s cheques up front. Used well, it lifts occupancy and smooths cash flow, which is exactly where net yield is won or lost.
Where 2026 cash flow is improving
When a community’s net yield rises through the year, rents are catching up to prices — a cash-flow upgrade for owners already in.
Net yield rising
- Dubai Sports City · 6.4 → 7.0%
- Al Furjan · 6.8 → 7.0%
- Liwan · 6.6 → 6.9%
- Motor City · 5.3 → 5.7%
- Dubai Silicon Oasis · 6.6 → 6.8%
Net yield compressing
- Dubai Hills Estate · 6.8 → 6.0%
- Dubai Creek Harbour · 6.0 → 5.6%
- Downtown Dubai · 5.8 → 5.4%
- Arjan · 7.1 → 6.6%
What it means
- Rising = stronger income now
- Compressing = price growth, weaker income
- Cash-flow buyers favour the risers
“Be honest with them. Show them the data — but make them understand the fundamentals.” — The principle behind every Veer & Sant guide
Our Approach to Rental Yields Optimizing 2026 Cash Flow
Model the net first
We build the real after-cost return before you buy — service charges, voids, management, finance, all in.
Match unit & location to income
The right zone, building and unit size for cash flow — not just the best-looking gross.
Choose the let model
Long-term for stability or short-term holiday lets where the location pays a premium.
Manage it in-house
Letting, renewals, maintenance and short-term management under one roof — closing the void leak.
Review the numbers yearly
Re-price to market, cut the leaks, and tell you honestly when to hold or reposition.
Your 2026 cash-flow checklist
- Are you comparing communities on net yield, not gross headlines?
- Do you know the service charge per sq ft before you commit?
- Have you sized the unit for yield (studio / 1-bed where income is the goal)?
- Is there a plan to keep voids near zero — management, early renewals, monthly payments?
- Have you chosen the right let model for the location (long vs short-term)?
- Are transfer, finance and FX costs amortised across your holding period?
- Will someone review and re-price the asset every year?
Straight answers
What’s a realistic net rental yield in Dubai in 2026?
Why is my net so much lower than the gross I was quoted?
Do high-yield communities actually pay more?
Is a short-term holiday let worth the extra effort?
How do I actually raise the net yield on a unit I already own?
Optimize your cash flow with people who model the net
No pressure, no pitch. We’ll run the real after-cost numbers on your portfolio or your next purchase — and tell you honestly where the cash flow is won.